Query statistics client-side by distance
Note: Support for 3D on mobile devices may vary, view the system requirements for more information.
This sample demonstrates how to query for statistics in a FeatureLayerView by distance and display the results of the query in a series of charts.
This app displays homicide data from 50 U.S. cities between 2007 and 2017. The data was gathered and analyzed by The Washington Post and is available for download here.
As the user drags the cursor across the view, the app queries and highlights all features within one mile of the cursor location using the FeatureLayerView. The charts immediately update with new data as the cursor location changes.
view.on("drag", function(event) {
  // query the layer view for each pointer drag event
  // then display the results in the charts
  queryStatsOnDrag(layerView, event)
    .then(updateCharts);
});
How it works
To query a layer view by distance, you first need to create a query object and set up the desired parameters. The createQuery() method on the FeatureLayer is a convenient way to construct this object with all the current configurations of the layer already defined on the object.
const query = layerView.layer.createQuery();
// converts the screen point to a map point
// the event object is returned from the drag event
query.geometry = view.toMap(event);
// queries all features within 1 mile of the point
query.distance = 1;
query.units = "miles";
Next, create array of StatisticDefinition objects, setting a field name and statistic type for each field for which you wish to query statistics. For statistic queries, you can query statistics for a field name or for data returned from a SQL expression. This sample executes nearly 30 statistic queries for each pointer drag. We'll only show a few of them in the following snippet.
// clone the query object from the previous snippet
const statsQuery = query.clone();

// date used to calculate the average time a case has been opened
const dataDownloadDate = Date.UTC(2018,6,5);

// Create the statistic definitions for querying stats from the layer view
// the `onStatisticField` property can reference a field name or a SQL expression
// `outStatisticFieldName` is the name of the statistic you will reference in the result
// `statisticType` can be sum, avg, min, max, count, stddev
const statDefinitions = [

  // Age of crime since it was reported in years

  {
    onStatisticField: "(" + dataDownloadDate + " - milliseconds) / (1000 * 60 * 60 * 24 * 365.25)",
    outStatisticFieldName: "avg_open_time_years",
    statisticType: "avg"
  },

  // total homicides

  {
    onStatisticField: "1",
    outStatisticFieldName: "total",
    statisticType: "count"
  },

  // crime disposition (aka crime status)
  //
  // Since this is a string field, we can use a similar technique to sum
  // the total of each status of the crime

  {
    onStatisticField: "CASE WHEN disposition = 'Closed by arrest' THEN 1 ELSE 0 END",
    outStatisticFieldName: "num_closed_arrest",
    statisticType: "sum"
  }, {
    onStatisticField: "CASE WHEN disposition = 'Open/No arrest' THEN 1 ELSE 0 END",
    outStatisticFieldName: "num_open",
    statisticType: "sum"
  }, {
    onStatisticField: "CASE WHEN disposition = 'Closed without arrest' THEN 1 ELSE 0 END",
    outStatisticFieldName: "num_closed_no_arrest",
    statisticType: "sum"
  },

  // average victim age
  //
  // Some victim ages are unknown and indicated with a -99. We'll
  // use an expression to treat those unknown ages as 0. This will
  // skew the average age slightly downward since we can't exclude those
  // values without a where clause. Do use a where clause, we could execute
  // a separate query

  {
    onStatisticField: "CASE WHEN victim_age_years = -99 THEN 0 ELSE victim_age_years END",
    outStatisticFieldName: "avg_age",
    statisticType: "avg"
  }

];
Once the statistic definition objects are created, pass them as an array to the outStatistics property of the Query object, then execute the query.
// add the stat definitions to the the statistics query object cloned earlier
statsQuery.outStatistics = statDefinitions;

// execute the query for all features in the layer view
return layerView.queryFeatures(statsQuery)
  .then(function(response){
    const stats = response.features[0].attributes;
    return stats;
  }, function(e){
    console.error(e);
  });
To query just a subset of the data, you can optionally set a where clause on the Query object.
// clone the query object from the previous steps
const openStatsQuery = statsQuery.clone();
// limit the results to only the crimes that did not result in an arrest
openStatsQuery.where = "disposition = 'Open/No arrest'";

// execute the query for only unsolved homicides in the layer view
return layerView.queryFeatures(openStatsQuery)
  .then(function(response){
    const stats = response.features[0].attributes;
    return stats;
  }, function(e){
    console.error(e);
  });
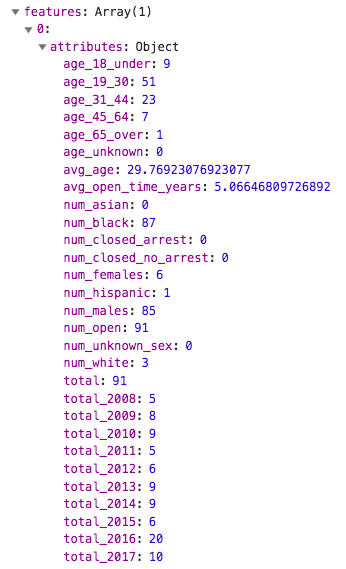
The result is returned as a single feature in a FeatureSet. The attribute name of each statistic is the name of the outStatisticFieldName set in the StatisticDefinition object. See the image below, which shows what the result of one of these queries looks like when printed to the browser's console.
Limitations
Client-side statistical queries are currently only supported in 2D MapViews.